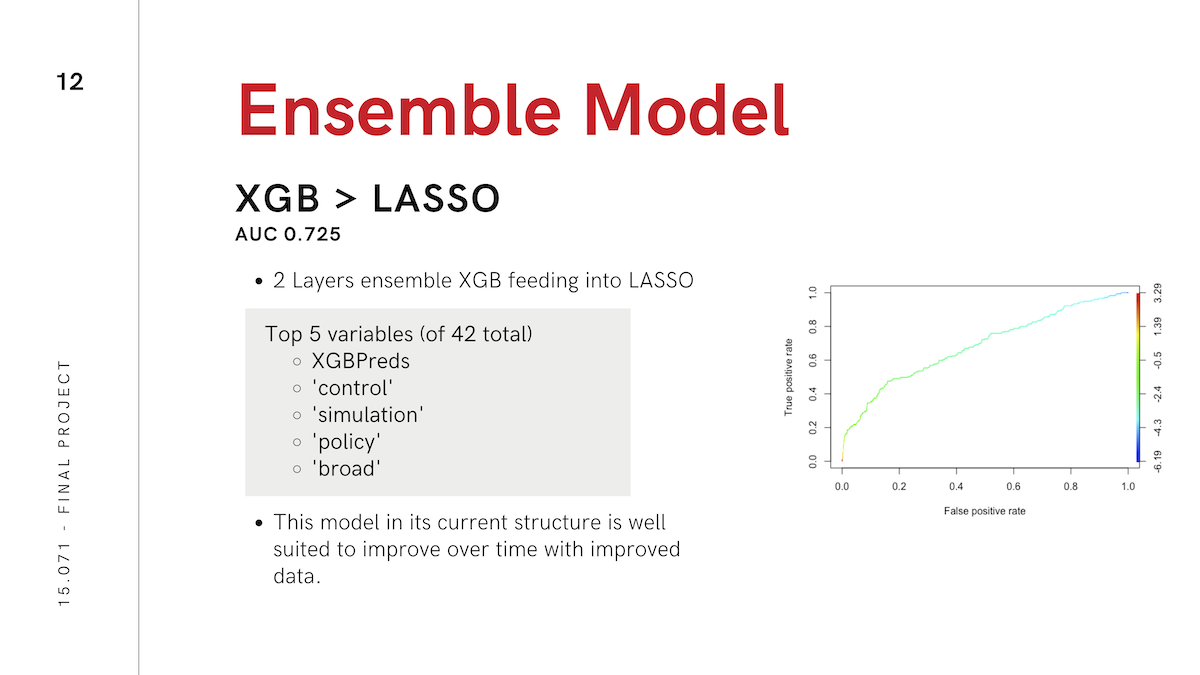
Building off my previous project in this area, myself and three other IDM students chose to build a course recommendation engine as the final project in the Sloan course, 'The Analytics Edge'. We used an ensemble learning model built on XGBoost and LASSO regression to build a model with an AUC of 0.725.
We pulled data from the IDM student course records, course evaluation data available to all MIT students, course descriptions, and the backgrounds of all students in our database as determined from their LinkedIn profiles. These data were cleaned in Python and evaluated using R.
Final Presentation Code on GithubAt the outset of the project we attemped to gather individual level course evaluations from IDM students. However, only about 120 students have ever gone through the program, so even if half of them filled out our survey (an ambitious goal) we would be fairly limited in our analysis. Instead we chose to use the complete list of which students had taken which courses, and make the following assumption: All students who took a course were happy about that choice, and all students who did not should not have. This changes the problem from a recommendation (matrix completion) engine a la Netflix to a logistic regression.
We were able to convince the registrars office to give us a download of all of the course descriptions we asked for. The final data needed were the backgrounds and career ambitions of the IDM students in our database. For this we scraped their LinkedIn profiles by hand.
Because of the wide variety in data sources, substantial cleaning was necessary to build it into the same table. The backgrounds and career ambitions were bucketed into 6 discrete choices that could be used as factor variables. The course descriptions needed to be broken up into a "bag of words," necessary for basic types of text analysis. The bag of words then was lowercased and cleaned of stop words, punctuation, and generic words applicable to all classes like "syllabus" and "graduate."
We then removed rows of data that fell into several categories that we felt were not relevant to our analysis. We removed courses only taken by one student, special seminars, courses in the IDM department, theses, courses for which there was no course evaluation data.
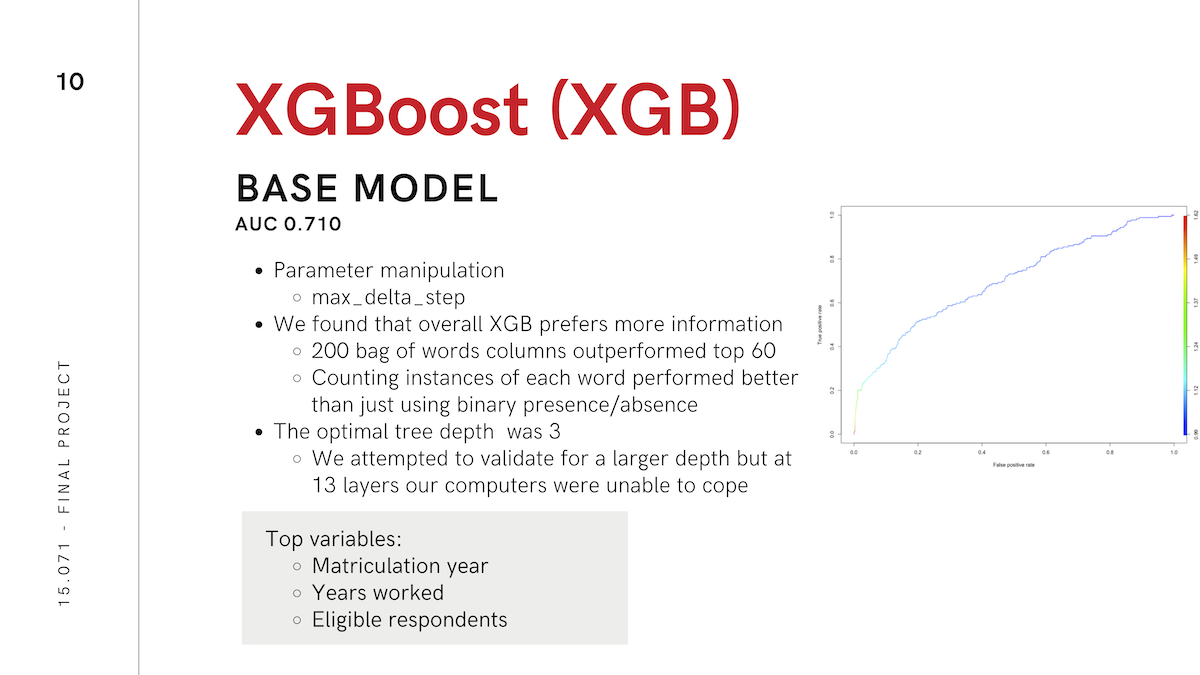
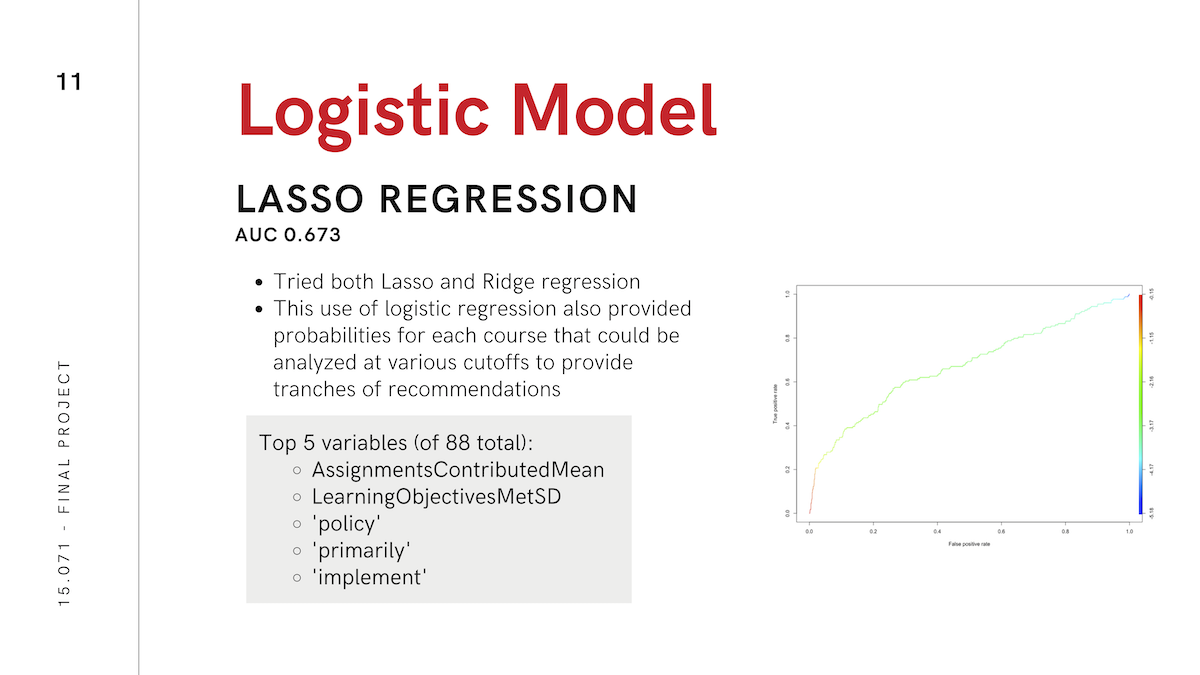
We tried many different analytical methods to try to optimize performance of our recommendation engine, including logistic regression, LASSO regularization, random forest, XGBoost, and CART. We achieved optimal performance (AUC ~ 0.725) using an ensemble of XGBoost and LASSO, with the output of XGBoost serving as an input column to LASSO.
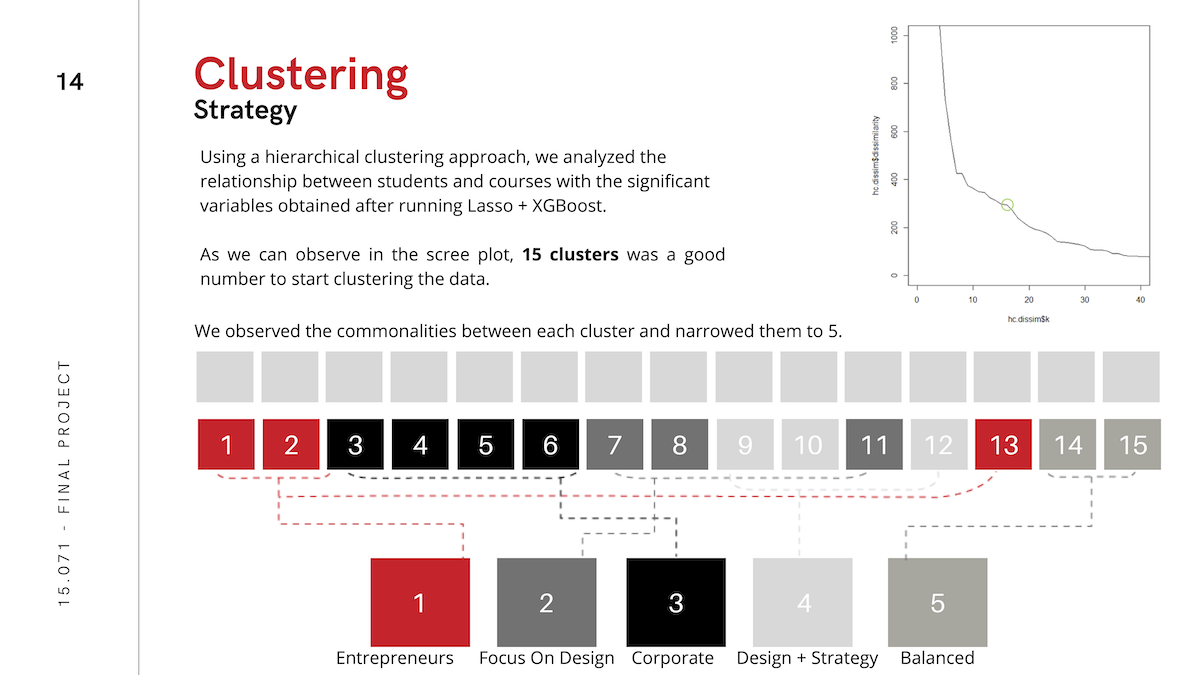
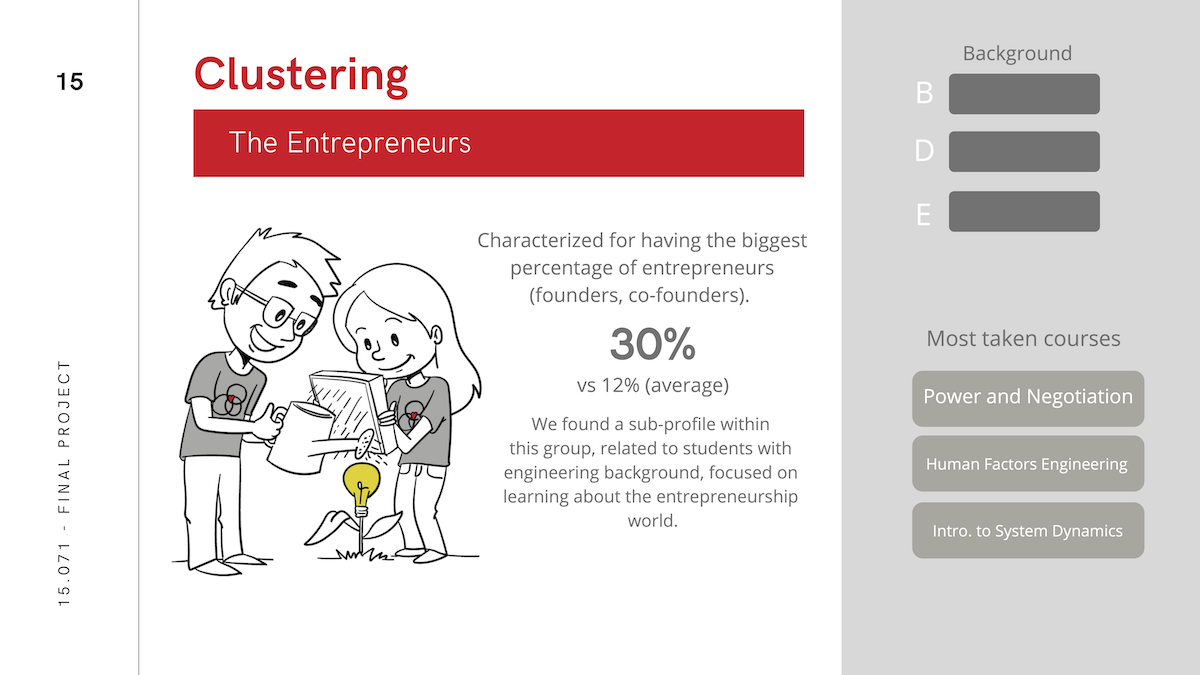
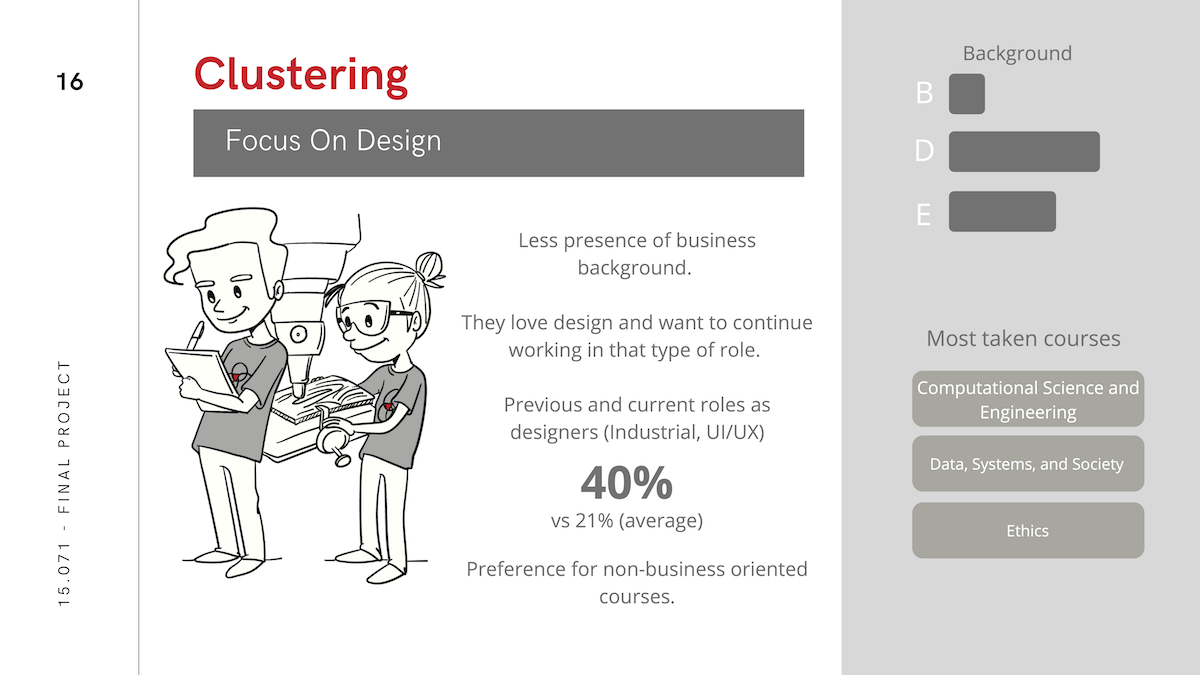
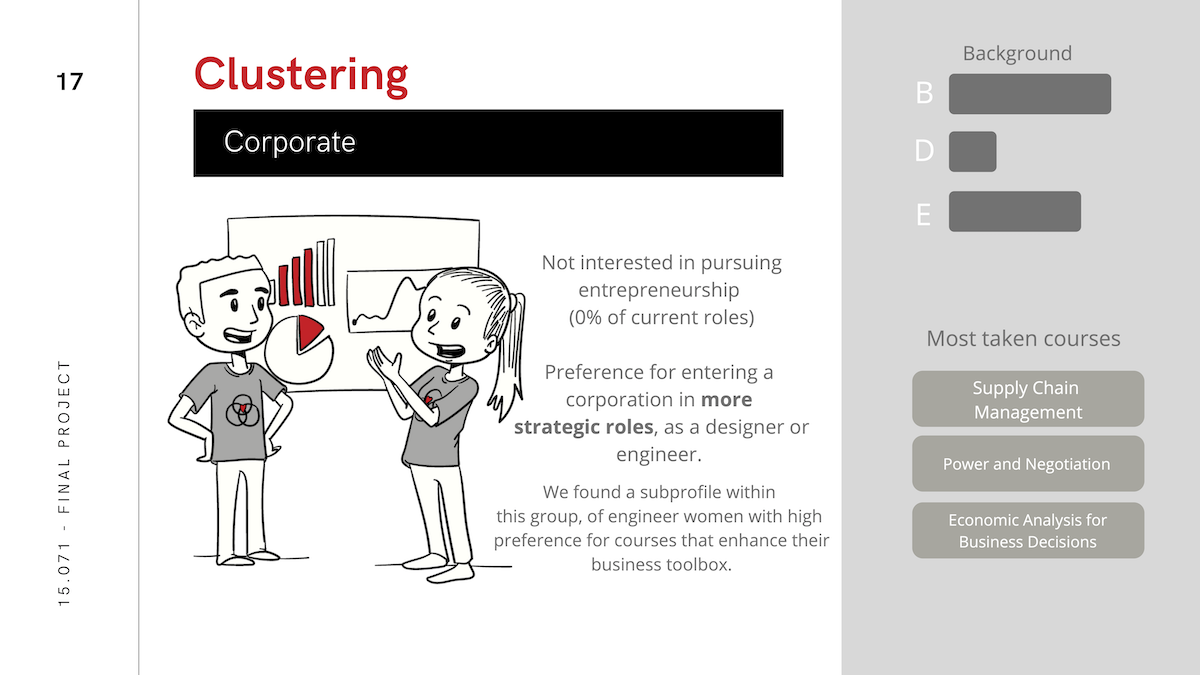
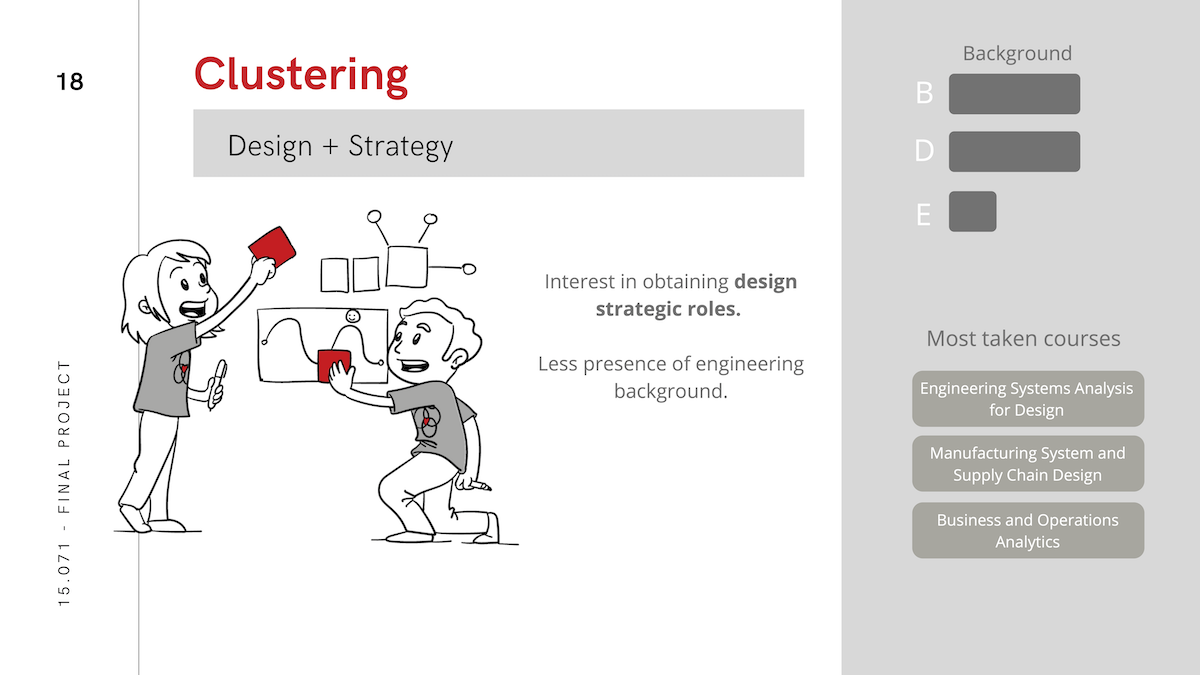
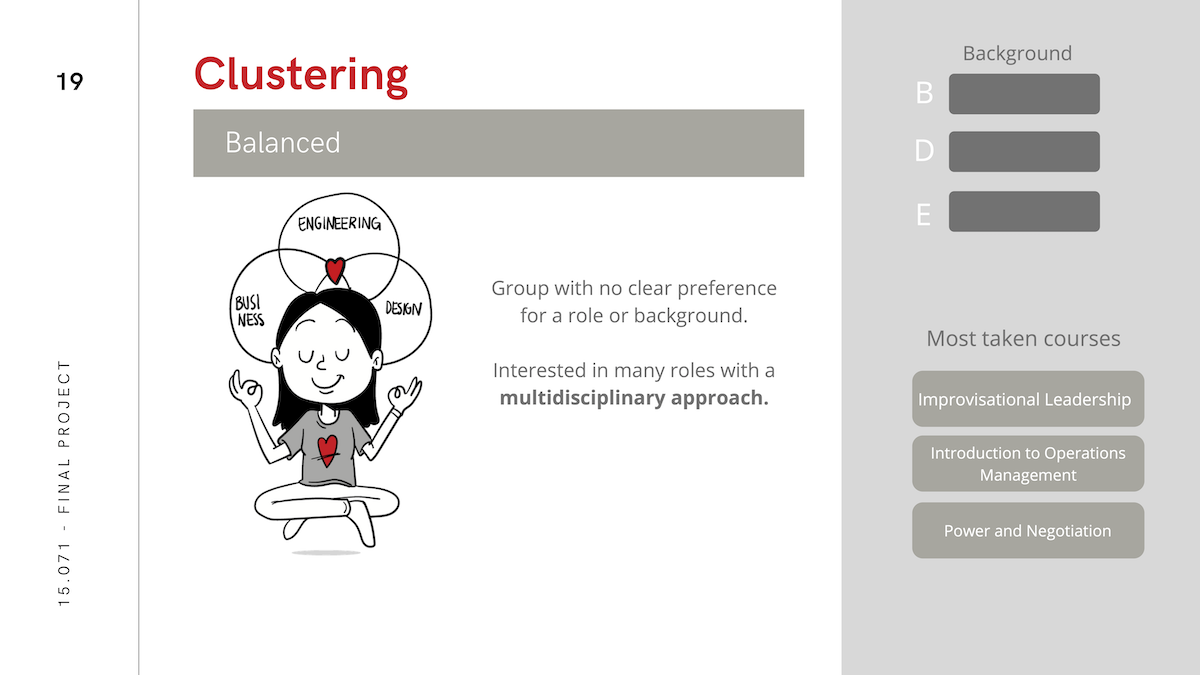
Because presentation of the analysis was as important for our purposes as performance, we also pursued heirarchical clustering as a way to tell a story about which kinds of people take which kinds of classes. You can see the results of this analysis below or in the deck linked above.
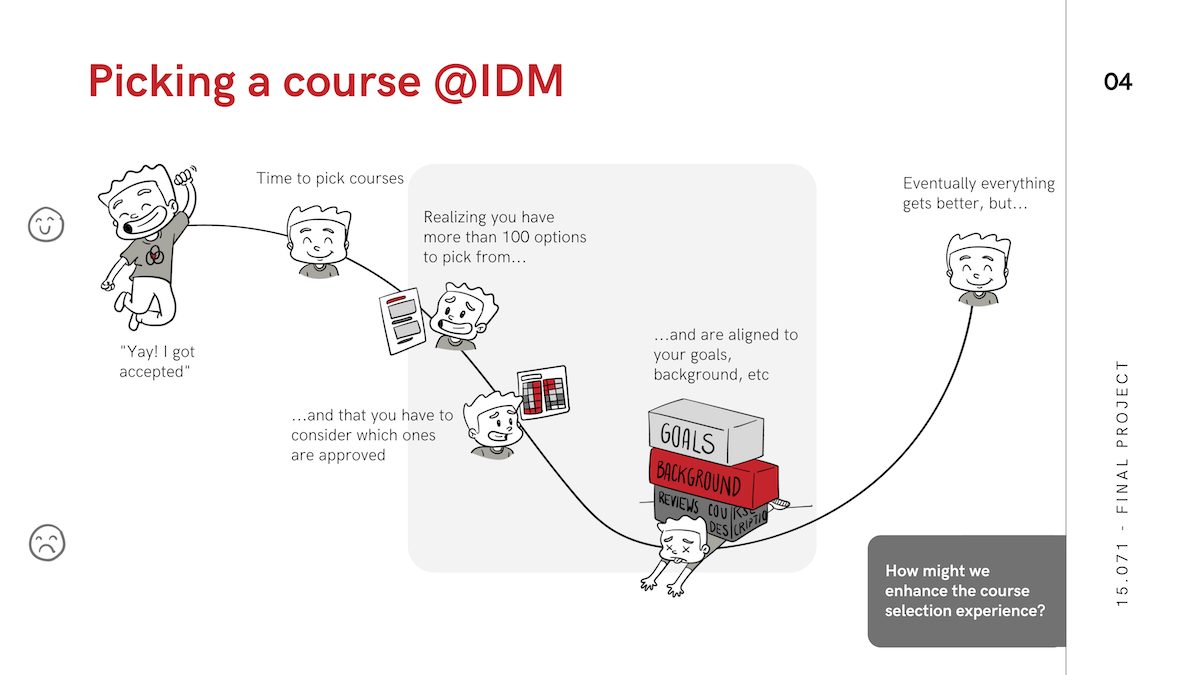
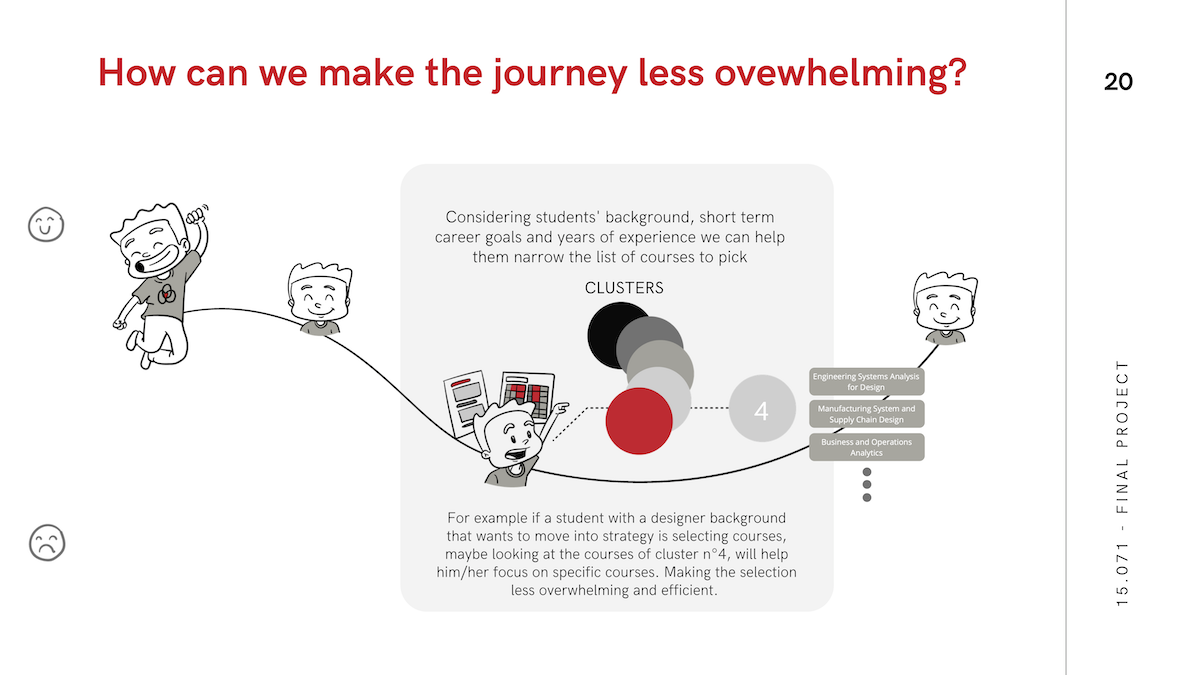
Seldom is any piece of analysis useful if it is not interpretable and actionable by people. We therefore structured our presentation in a narrative format most useful to IDM students looking for help in course selection.