Political polarization is most commonly measured through survey responses. In the fall of 2020 I co-authored a study where we attempted to measure political affective polarization directly using computational techniques to track facial movement, vocal inflection, audio transcription sentiment, and heart rate.
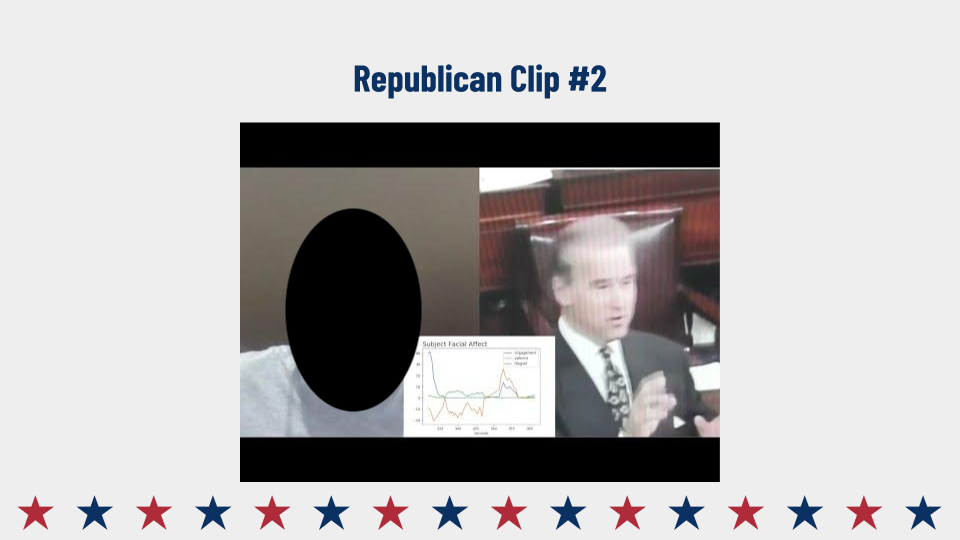
This effect can be measured by analyzing the video and audio recordings of the subjects and extracting signals from them. The signals we analyzed were facial affect from facial action units, vocal transcript sentiment and heart rate (rPPG).
Subject videos have been removed from the presentation below to protect subject privacy. Slide design is from SlidesGo.
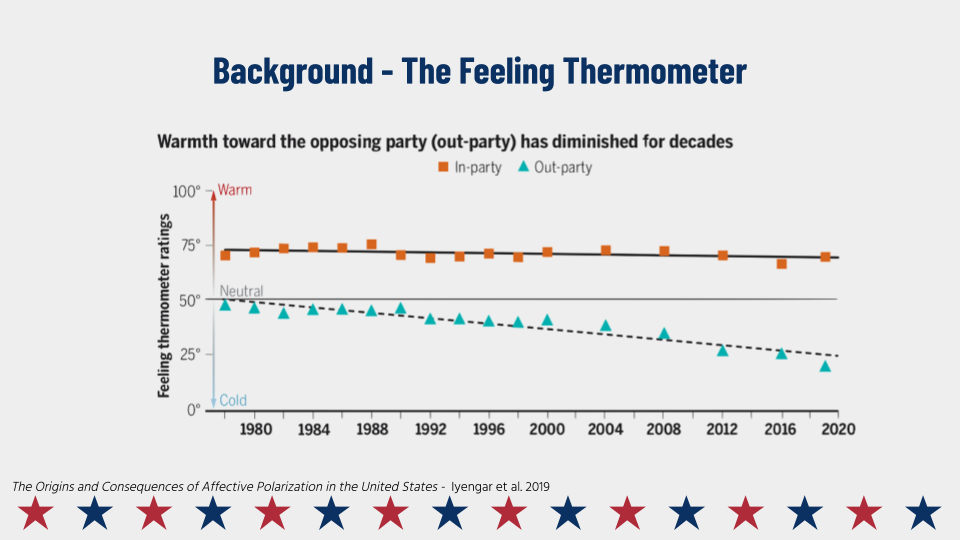
Presentation Paper GithubWe began the project by performing a thorough review of the current literature on affective polarization to see which tools were being used and how our methodology might fit in to the current work in the field.
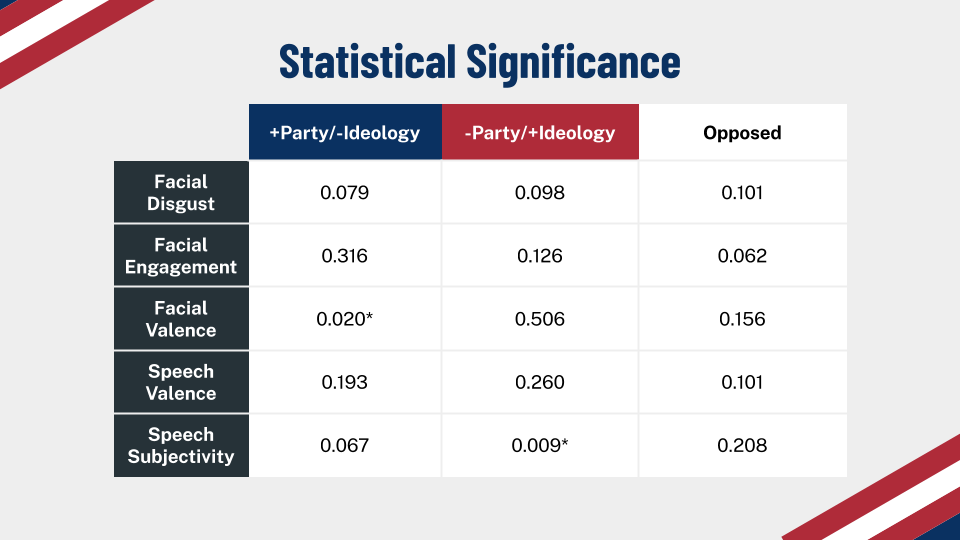
We decided to test the hypothesis that people would reactmore negatively to videos of people from the other party than to videos of people from the same party saying something they disagreed with, a conclusion which was already supported to some extent in the literature.
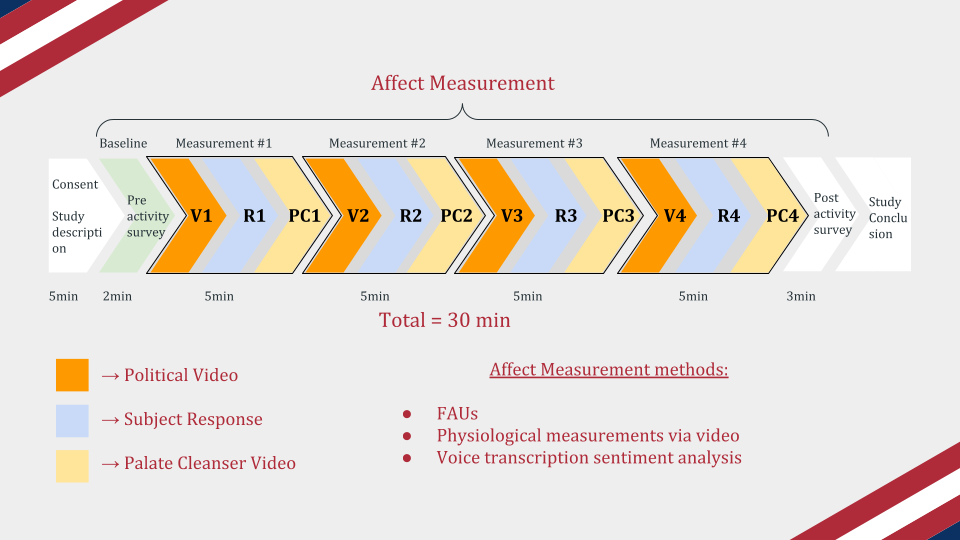
After deciding that our study would add to current understanding in the field, we set out to design a study participant flow that would be able to test our hypothesis. First we needed a baseline condition, where we asked participants to fill out a non-provocative survey and take a moment to sit quietly before beginning the experiment. Next we wanted to ensure that each study condition would not unduly influence the following conditions, so we built in "palate cleanser" videos which were simply videos of silly advertisements taken from YouTube. Finally we needed to gather the political and ideological alignment of our participants, so we had them fill out a post-study questionnaire. We did this after the completion of the experimental portion of the study so that our participants were not primed by how they thought they should react to what was being shown.
Do to the ongoing COVID-19 pandemic, we had to administer the study remotely. Therefore, we built a website that could perform data collection automatically. Functionality in the website included: a front end user flow, a way to randomize videos and palate cleansers, a way to track timestamps associated with each website action, a way to record video and audio of participants and stream it to the database, a way to track unique participant IDs, a way to gain consent from subjects, and a way to debrief subjects at the end.
The front end was built with Javascript and React, and the back end was built with PHP and MySQL. You can see a walkthrough of the website here.
We ended up with 7 different data streams: facial engagement, facial valence, facial disgust, facial joy, vocal subjectivity, vocal polarity, and heart rate. We tried several different regression methods to analyze these data, with multi-level logistic regression providing the best combination of performance (AUC = 0.74) and interpretability. This choice assumes that each participant has a random level of baseline affect across each condition, which is supported by the affective computing literature.